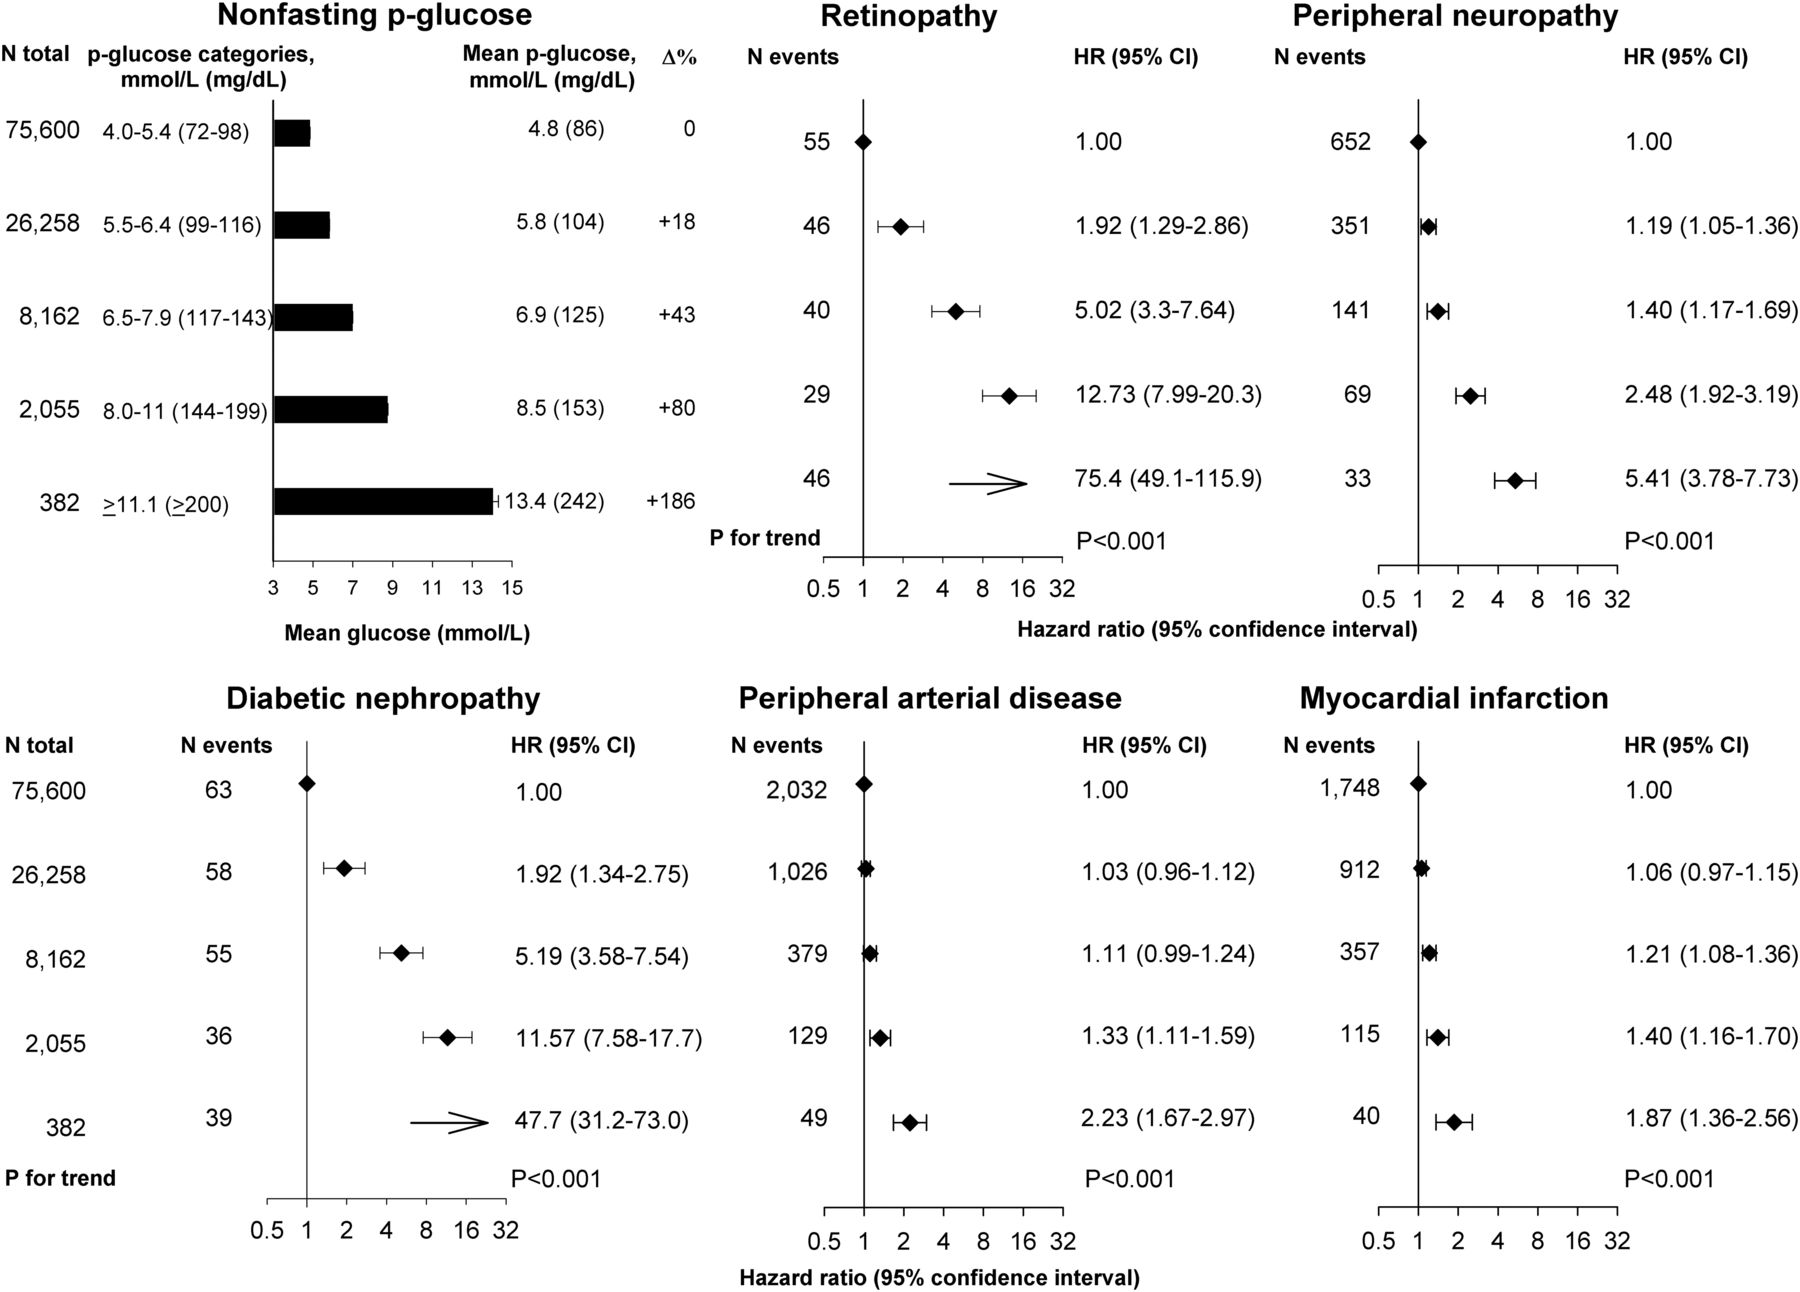
 The ugly data is shown in Figure 1 of the paper, which buckets mean p-glucoses
of 86, 104, 125, 153 and 242 mg/dL, correlating to A1c values of 4.6%, 5.1%,
5.7%, 6.5% and 9.0% The hazard ratios are anchored at 1 for the 4.6% cohort and
go up from there. For retinopathy, the HRs are 1.92x, 5.02x, 12.73x and 75.4x. The term hazard ratio simply means "N-times more likely" and so a person with a 5.7% A1c is
5.02x more likely to experience retinopathy than a person with a 4.6% A1c. A
person with a 9% A1c is 75.4 times more likely.
Figure 1 from the paper:
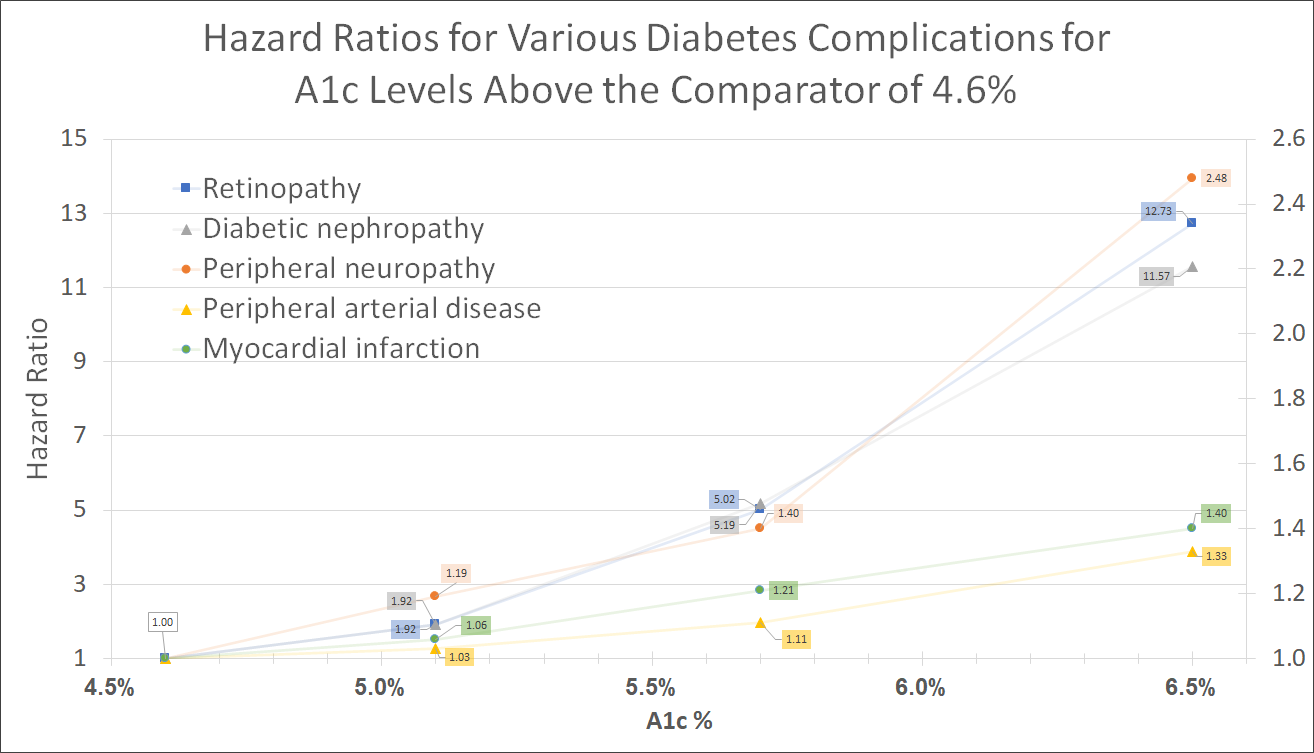
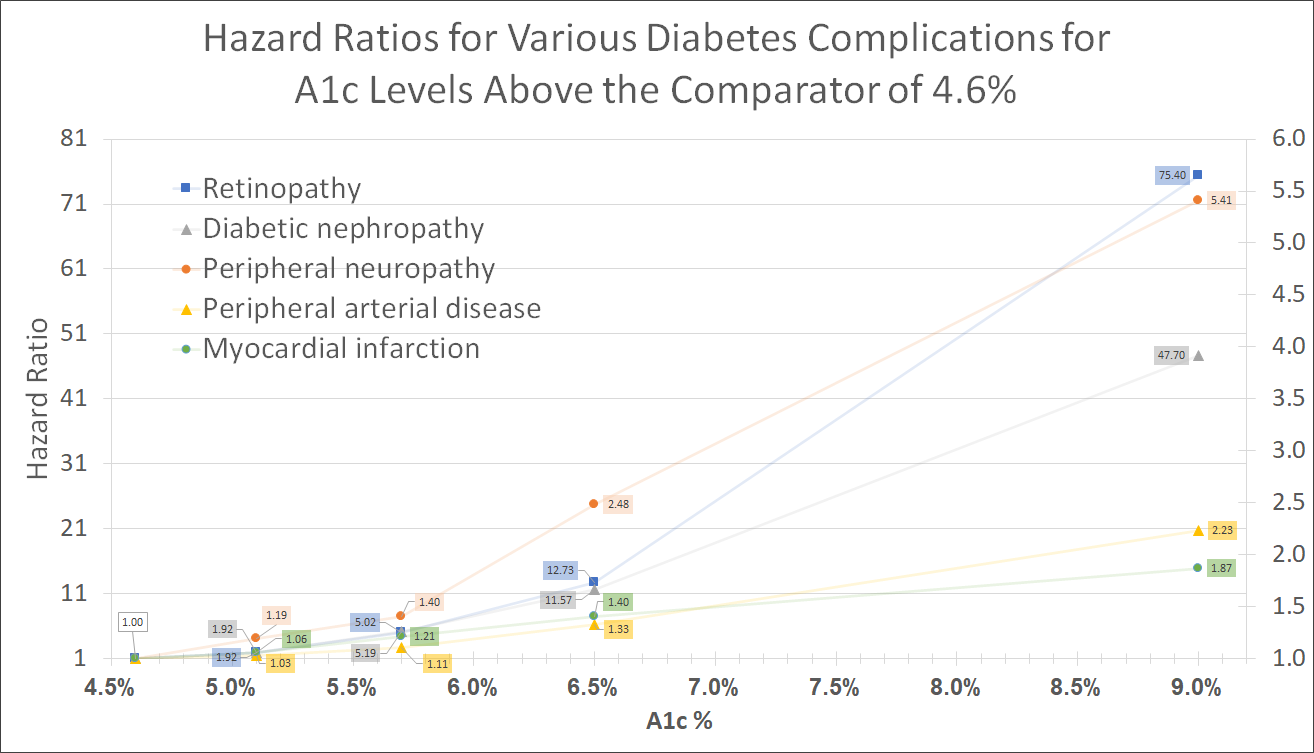
All hazard ratios presented in the paper are:
The ugly data is shown in Figure 1 of the paper, which buckets mean p-glucoses
of 86, 104, 125, 153 and 242 mg/dL, correlating to A1c values of 4.6%, 5.1%,
5.7%, 6.5% and 9.0% The hazard ratios are anchored at 1 for the 4.6% cohort and
go up from there. For retinopathy, the HRs are 1.92x, 5.02x, 12.73x and 75.4x. The term hazard ratio simply means "N-times more likely" and so a person with a 5.7% A1c is
5.02x more likely to experience retinopathy than a person with a 4.6% A1c. A
person with a 9% A1c is 75.4 times more likely.
Figure 1 from the paper:
All hazard ratios presented in the paper are:
| Micro- and Macrovascular Disease | 5.1% | 5.7% | 6.5% | 9.0% |
|---|---|---|---|---|
| Retinopathy | 1.92x | 5.02x | 12.73x | 75.4x |
| Peripheral neuropathy | 1.19x | 1.40x | 2.48x | 5.41x |
| Diabetic nephropathy | 1.92x | 5.19x | 11.57x | 47.7x |
| Peripheral artery disease | 1.03x | 1.11x | 1.33x | 2.23x |
| Myocardial infarction | 1.06x | 1.21x | 1.40x | 1.87x |
 The same visual limited to A1c = 6.5%: